Active Directory Spotlight: Windows Event Forwarding & Windows Event Collector
Windows Event Forwarding has been around for 20 years and has since then been underestimated in its role to make use of log events for companies of all sizes and especially in small and medium sized companies. Windows Event Forwarding (WEF) offers a simple, free and already built-in solution to configure Windows workstations and servers to send encrypted log events to a centralized location for storage, analysis, attack & anomaly detection. Sounds good, but what value does 'forwarding events' add if I got no such centralized location to send the data to? And that's neat part: Microsoft also provides the free, simple and already built-in counterpart server role that can act as a receiver for all your forwarded events, which is called Windows Event Collector (WEC).
The Windows Event Collector - which has, as well, been around since Windows Server 2003 - is in essence a warehouse for event logs, that handles a fair amount of event logs being forwarded to a single instance and also allows to define multiple, custom policies for log collection, e.g.: A baseline policy for all Windows host, a "high visibility" policy for critical TIER-0 systems (such as Domain Controllers) or a "suspect" policy for hosts that might have been compromised.
Thus the key message of this blog post is:
Combining Windows Event Forwarding and the Windows Event Collector adds immediate, significant visibility into any Windows-based network, while being free and using already built-in features. While these components can benefit any company, especially small and medium sized companies, who potentially do not have any detection - or even broader: any visibility - capabilities, can gain significant middle- and long-term value from utilizing Windows Event Forwarding and the Windows Event Collector.
This blog post aims to be a guide to set up this logging infrastructure and show the benefits of it.
A Very Brief Terminology Introduction
Before diving into how to set up Windows Event Forwarding and the Windows Event collector, let's quickly roll over the terms that are going to be used and how these relate to each other in the context of this topic. Basically, there are only 3 important elements that we need to highlight:
- A Windows Event is a text-bound notification about something that happened on a host, for example a user logging into the machine, an application crash or system setting being changed.
- Channels are containers to store events. You can forward events into a channel, which corresponds to a '.evtx' file on disk, in which the events are stored.
- Subscriptions are playbook definitions of what should be collected (meaning: which events) from which hosts and where to store these events (meaning: in which channels).
All of these terms will get clearer (and more visual) with the following sections. For now it's just important to keep in mind that events are created and stored locally on each Windows machine, where a Windows Event Collector service can be used to instruct a host to send a customizable set of events to a centralized location, as visualized below:

A Basic Setup
Requirements Technically there are no requirements, you could create an Event Collector on every Windows client or server machine and forward events to this host. Although no extra machine is technically needed we recommend having a dedicated Server instance, e.g. Windows Server 2019, to act as Event Collector.
Design Decision Before I go into the few steps that are required to setup the logging infrastructure, there are some design decisions that will implicitly be made in the following and I want you to be aware of those:
- Push vs. Pull strategy: You can instruct your source computers to either push events to the WEC server or instruct the WEC server to pull events from specified computers. If you don't have a good reason to choose the pull strategy, one should always default to the push strategy.
- Scope of source computers: You can of course choose from which computers you want to collect logs. If you set up WEF initially, start with a single host for testing purposes and then expand. In a fully set-up environment all Windows hosts should be included in the scope of WEF.
- Number of WEC servers: You can of course operate more than one WEC server, which you might consider for the following reasons:
- Failover if one WEC goes down or runs out of disk space
- Microsoft's documentation estimates that you could serve 2000 to 4000 source computers with a single WEC server that is equipped with 16GB RAM and 4 processors. If you have more than 2000 computers in your domain, you should setup a second WEC server to split the load.
Note: There is no built-in failover or load balancing integrated with WEF, so you'd need split ranges manually and assign different WECs. For the setup below, we will start with a single WEC server and a single source computer.
Setup
Step 1: Start and auto-configure WEC service
In the first step we'll log onto our dedicated WEC server and start the WEC service via C: #WEC-Server> sc.exe start Wecsvc.
To ensure that the WEC service is started automatically whenever our WEC server boots up, we also set the start-type of this service via C: #WEC-Server> sc.exe config Wecsvc start= delayed-auto. Alternatively - and this is what I did in my lab environment - you can use a GPO to define the start-type of the WEC service on WEC servers. This allows to spin up additional WEC servers, which will have the service automatically started.
Next, we configure the WEC service using the following command: C: #WEC-Server> wecutil.exe qc /q
Step 2: Creating Subscriptions
To create a subscription open up the Event Viewer (Eventvwr.msc) on the WEC server, make a right click on the "Subscription" menu on the left and click "Create Subscription" as shown below:

As an example create a subscription with the following settings. Note that all of these, except for the subscription name, can be changed at any time:
- Subscription name: For testing purposes create a subscription named 'TestSubscription'.
- Destination log: This is the event channel that will hold all events send to this subscription. Leave this at "Forwarded Events".
- Subscription type and source computers: Here you can define if you want a pull ('Collector initiated') or push strategy ('Source computer initiated'). As mentioned previously we'll go with a push strategy and only add a single computer account from our domain for testing purposes. If the subscription is successful, we can always expand the scope later on.

- Events to collect: Here we can select which events we want to collect in this subscription. To start off we want Critical, Error, Warning and Information events from the Security log. Make sure you start with a small set of events to avoid flooding your WEC server and keep the number of events managable for us.

- Configure advanced settings: This menu can be used to configure some additional settings (others can be set through the command line). Set the 'Event Delivery Optimization' to 'Minimize Latency' and leave the protocol to 'HTTP'. The 'Minimize Latency' setting is used for initial testing purposes as this will cause events to be delivered with minimal delay (pushed every 30 seconds). This setting is documented here. Although the protocol is set to 'HTTP' all events are sent over the wire encrypted. The HTTPS options is meant to allow for the usage of client certificates in environments that are certificate driven. The 'HTTP' option can therefore safely be used in production environments.

Clicking 'Ok' will then create the subscription, which will be listed as 'active' in the 'Subscriptions' view. Before going to instruct clients to connect to this subscription, I like to inspect the properties of the channel in which collected events will be placed, which is the 'Forwarded Events' channel. Right click on the 'Forwarded Events' channel on the left and select 'Properties':

In this window you can see the settings for this event channel. Important to note here are the location of the channel's .evtx file (in case you want to backup this), the defined maximum size of the channel (which should be increased for production uses) and the log turnover settings, which I've set to 'Archive' (default is 'Overwrite').
Step 3: Connect clients to the WEC server
The WEC server is now up & running and a subscription has been created, so everything is ready for clients to connect to the WEC server and push events. The following steps will be conducted in our 'push' (Source computer initiated) strategy from the client's perspective:
- The clients will be informed about an active WEC server on a specified network address.
- This will cause the clients to connect to the WEC server and query for active subscriptions.
- The WEC server will tell the clients about active subscriptions that they are enrolled in (specified via the 'Subscription type and source computers' option from above).
- If there are active subscriptions for a client, the client will attempt to read the specified log events (specified via the 'Events to collect' option from above) and forward the events in scope to the WEC server via WinRM.
This rundown describes several requirements that need to be set in order for this to work:
- The clients need to be informed about the WEC server.
- The clients must be able to reach the WEC server through HTTP.
- The service running on the clients - which runs as the 'NT Authority\Network Service' user - must be able to read the specified logs.
- The WinRM service must be running on the clients to push the events to the WEC server.
The network design and firewall rules in your environment should allow for the second requirement, the rest can be set through GPOs. In my lab I added the required settings for the remaining three requirements in a single GPO, but these can of course be split up to allow for a more fine-grained control.

Let me add a few notes to these settings:
- Setting the Subscription Manager: This specifies the WinRM endpoint of the WEC server, which in my lab lives at WECSrv1.SafeAlliance.local. The setting is set to:
Server=http://WECSrv1.SafeAlliance.local:5985/wsman/SubscriptionManager/WEC,Refresh=30. This setting allows to set a refresh rate (see the comma-separated last bit of the connecting string). This last parameter specifies how frequent (in seconds) clients connect to the WEC server to check for updates. For testing purposes a value of 30 (seconds) or less is a good interval to get started. If all subscriptions are fully set-up and do not change frequently this value can be set to multiple hours or a day. - Adding Network Service to the Event Log Readers group: This is just one way for our current case to allow the 'NT Authority\Network Service' account to read the log files that we specified in the subscription. In our case we defined that we'd like to receive events from the client's 'Security' event channel. Using the built-in tool
wevutilwe can check the access permissions that this channel has on a given client system using the commandwevtutil get-log security: As stated by the 'channelAccess' attribute, access is granted to the 'NT Authority\System' (SY) user, to the 'Builtin\Administrators' group (BA) and to the 'Builtin\Event Log Readers' group (SID: S-1-5-32-573). To allow access to the 'Network Service' account we could also extend this Access Control List, but I prefer to add the 'Network Service' user to the 'Event Log Readers' (S-1-5-32-573) group. If you extend your subscription, this can become a common pitfall as the
'Event Log Readers' group might not be allowed to read all event channels. So keep in mind that the network service on the clients needs to able to read the log channels you specified (see the 'Troubleshooting' section for further notes).
As stated by the 'channelAccess' attribute, access is granted to the 'NT Authority\System' (SY) user, to the 'Builtin\Administrators' group (BA) and to the 'Builtin\Event Log Readers' group (SID: S-1-5-32-573). To allow access to the 'Network Service' account we could also extend this Access Control List, but I prefer to add the 'Network Service' user to the 'Event Log Readers' (S-1-5-32-573) group. If you extend your subscription, this can become a common pitfall as the
'Event Log Readers' group might not be allowed to read all event channels. So keep in mind that the network service on the clients needs to able to read the log channels you specified (see the 'Troubleshooting' section for further notes).
Once these settings have been pushed to a specified group of test clients you should see events being forwarded to your WEC server:

Side note: The first (information level) event that a computer will send to your WEC server is the event ID 111, which can also be used as an indication that a computer successfully checked in.
Audit Policies - You can only see what you log
If you have not already specified audit policies in your domain, you will only receive events that are logged by default. Configuring and maintaining audit policies will allow you to extend the amount of events logged on each Windows hosts and will also enable you to adjust your logging to new attacks and exploits. There is however a challenge in the creation of audit policies, which is: Only logging events that are relevant and valuable for any given system in an environment that consists of various systems of different criticalities. A good approach to tackle these challenges is to not create a single audit policy that has to cover all systems and situations, but instead create multiple policies that complete each other. In my environment I've set up these audit policies:
- A baseline audit policy that is applied to all computers and covers a good range of events of interest.
- A TIER-0 audit policy that is applied to all TIER-0 computers and extends the baseline policy.
- A TIER-1 audit policy that is applied to all TIER-1 computers with a focus of system and application stability and availability.
- An Investigation policy that has a high level of logging to ease incident response investigations and allows high visibility in system operations. This policy is not applied per default to any computer, but can be used on demand if anomalies or potential attacks are detected.
These four policies allow to log events in a scalable, adjustable as well as manageable manner and prepare an incident response setup. That leaves one with the question of how to configure these policies. To get started there are various posts with recommendations about best practice audit policies, e.g. here, here, here or here. However, I would recommend to not blindly copy/implement any given recommendation, but instead have one or two recommendations on the side for comparison and then step through the audit options yourself to make decisions based on your environment. I've put the different recommendations from above in a list and added the settings for my environment on the side. You can find my comparison here, which might be a helpful start. One important thing to be aware of when reading through different recommendations: It's not always clearly stated what the purpose of a given audit policy recommendation is or where (on server, clients, DCs, all computers, ...) this audit policy should best be applied to. Some audit options do only apply for certain systems (such as DCs), whereas others might cause high volume on client systems, but low volume on server systems. Therefore, comparing different policy recommendations can be confusing. To tackle this challenge make a clear plan for different audit policy objectives (e.g. baseline vs. investigation) and adjust settings to your environment and logging capabilities. If in doubt it's always worth to make a test run on a few dedicated systems (via GPO) with verbose audit logging and then shrink down in case you're flooded with events. Test and tweak is the way to go.
Fine-Tuning Subscriptions
Up to this point we've instructed the AD domain to collect valuable audit logs, set up a WEF pipeline to a WEC server and are collecting events in a central location. If there was no other logging or SIEM solution in place before, the steps above significantly improve our logging, visibility and investigation capabilities. However, this setup is not quite ready for production yet. If you followed the instructions you will have a set of fine-tuned audit policies, adjusted for different systems and events in your domain. But all of these systems connect to the same subscription, meaning that although different events are collected on each host system (due to our audit policies), all hosts report the same set of events to the WEC. The solution here is to create a set of subscriptions to match your audit and visibility needs. As with the audit policies there is no single best practice for the right number or configuration of subscriptions as this needs to be customized to your environment, logging capabilities and needs. But to get started here are the four subscriptions that I set up for my environment:
- A Baseline subscription that is applied to all computers in the domain. This subscription instructs the domain computers to forward all events from Microsoft's baseline annotated queries list.
- A TIER-0 subscription that is applied to all TIER-0 systems. As a starting point I'm collecting events from the four Windows event channels (Application, Security, Setup, System).
- A TIER-1 subscription that is applied to all TIER-1 systems. As with the TIER-0 subscription, I'm collecting events from the Windows event channels.
- An Event-Investigation subscription, that is applied to all computers in the domain. I'm using this subscription to monitor specific events, which might indicate an attack. As a starting set I'm using a list of events recommended by the NSA here. This dedicated subscription allows me to add and fine-tune events linked to known attack techniques over time while not affecting my baseline logging.
- A Host-Investigation subscription, that is initially not applied to any source computer. This subscription is used to collect events from manually specified hosts over a certain time period to get a detailed information of individual hosts that might have been compromised. I'm using Microsoft's annotated suspect subscription query list to collect events.
You can find the samples I used in my lab for all five subscriptions mentioned abvove here
These sets of event subscriptions will put you in a good position to manage, customize and extend the event visibility in your network. Having multiple subscriptions does bring up a new problem though: With the initial configuration all subscriptions would place events into the same event channel ('Forwarded Events'). This makes it hard to analyze the logs and make effective use of the different subscriptions. A solution for this is to create custom event channels and forward events from each subscription into a separate channel. There is a detailed step-by-step guideline on how create custom event channels using the 'ecmangen.exe' tool here. This tool used to ship with the Windows 10 SDK, but it's now discontinued. As an alternative elastic has a detailed description on how to create event channels using PowerShell in their Windows Event Collector Cookbook. The outcome of these adjustment steps could look like this:
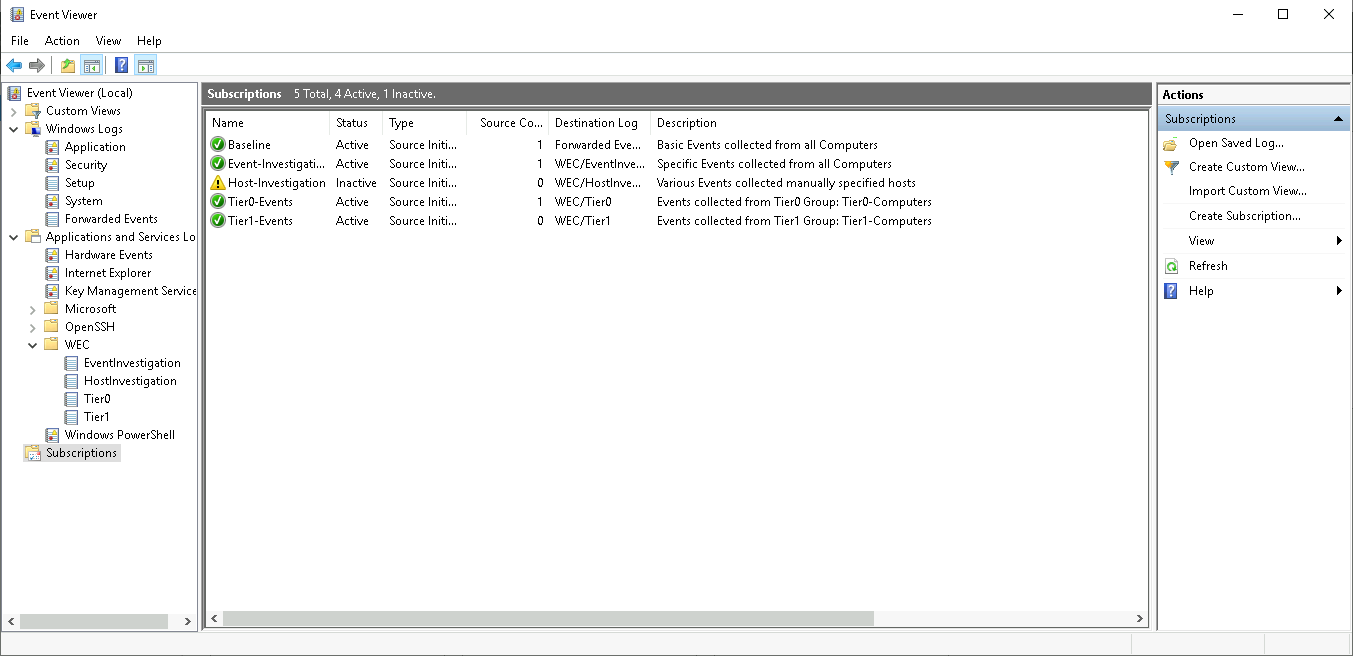
Note that the 'Host-Investigation' subscription is marked inactive, which is due to the fact that no source computer is defined for this subscription.
Extra Mile: Adding ELK
With the steps from above you should have a centralized logging and event management pipeline in place that allows for targeted analysis using the Windows Event Viewer. While the Windows Event Viewer is certainly a good tool, some people tasked with analyzing these collected logs might miss some more advanced monitoring capabilities, such as trend graphs of monitored hosts, incoming events or other grouped event metrics. To match those needs a free and open source ELK (Elasticsearch, Logstash and Kibana) stack can be set up as an additional layer for analysis, monitoring and anomaly detection. Discussing the details of adding ELK as an extra mile would make up for a post on its own, so I'll leave it with the most important bits at this point:
- Roberto Rodriguez created the great HELK (Hunting ELK) project, that has ready-to-use scripts to set up a complete environment with pre-build dashboards and visualizations. I highly recommend checking out HELK to familiarize with the topic and features.
- While you can use HELK, you could also set up "just" an ELK server and build as well as customize your open-source monitoring on your own. The benefit for the time investment: You learn the tool stack, its management and debugging options.
- To ship events to your ELK server you want to use winlogbeat from your WEC server.
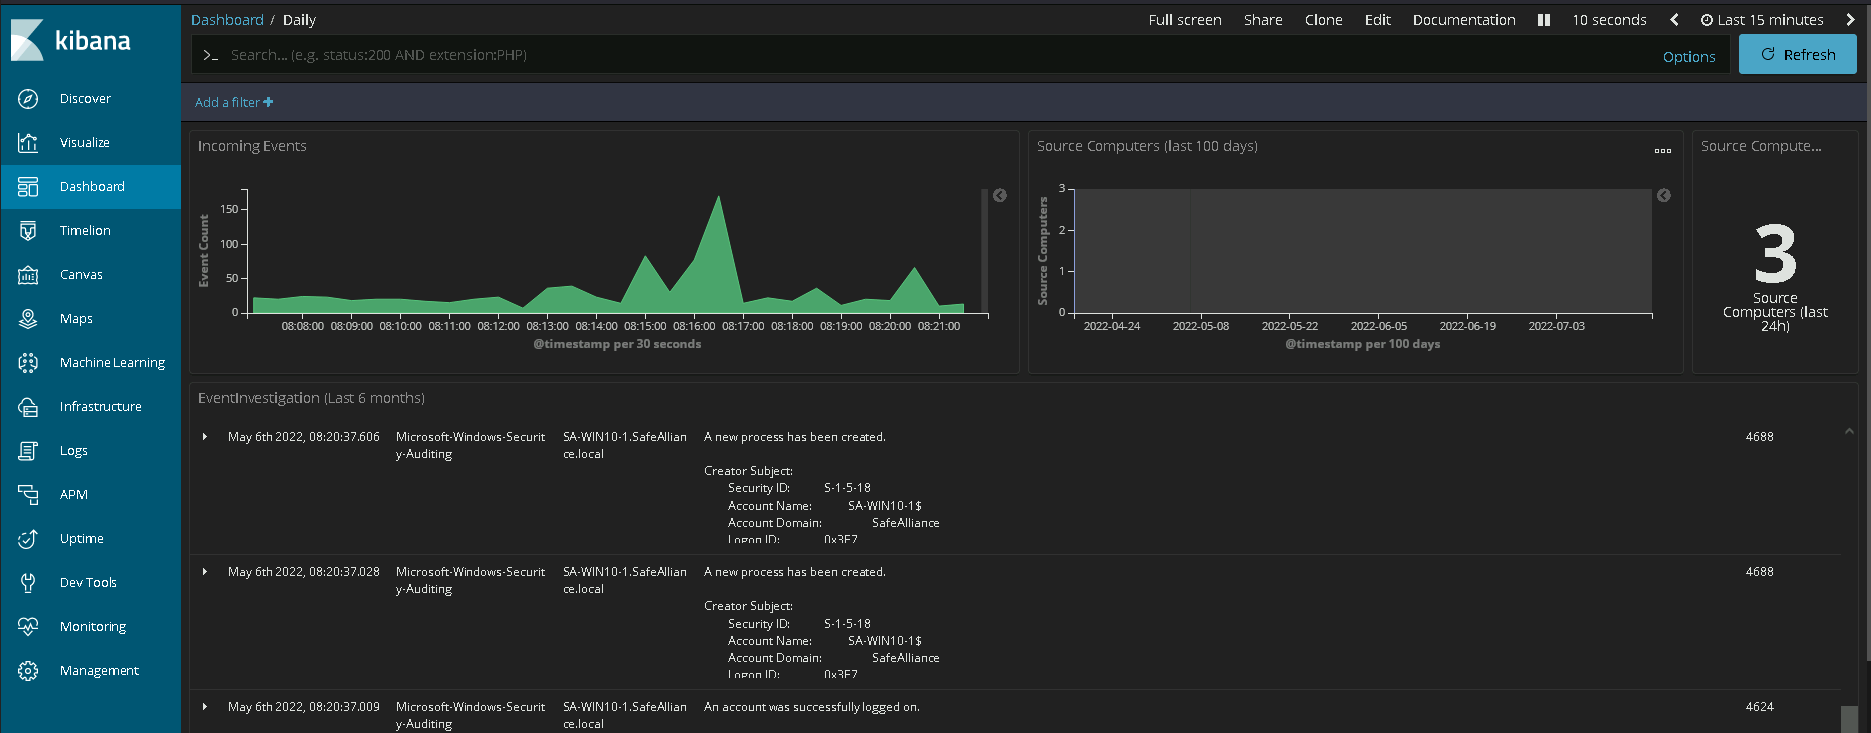
A simple starter dashboard using the ELK stack could look like this:
FAQ
What about the cloud? So far, all of the above seems to be made for on-premise Active Directory environments. What if I'm a cloud (Azure) customer? If you're running a hybrid or full-cloud environment you can of course monitor your cloud and your on-premise hosts, but you'd have to make a few design and budget decisions. First of all: If you're living in a hybrid environment you should made a strategy decision whether you want to collect (and analyze) your data on the cloud side or on-premise. Going into the full details of both directions would exceed the scope of this blog, but Microsoft's future direction is quite clear. Microsoft's recommendations and official tooling will likely ease data transfer into the cloud and limit capabilities to extract data from cloud systems for on-premise logging and analysis (note that in Q1 of 2022 Microsoft's cloud earnings roughly doubled or tripled their Windows earnings). If you want to follow Microsoft into the cloud you'll need to pay for good logging and analysis capabilities, which includes an agent that pushes your logs into the cloud. Microsoft built advanced threat analytic tools years ago (Advanced Threat Analytics (ATA) came out in 2015) and meanwhile has moved these under the "Defender for Identify" umbrella into cloud-only products, which require licensing. On the other hand you could query Azure for logging data through the various Azure APIs and Graph API, but as far as I'm aware no great tooling exists to convert this data into Windows events. However, tooling to push this data to an ELK stack is on its way.
It's free, already built-in and provides significant visibility... where's the catch? Yes, Windows Event Forwarding (WEF) and the Windows Event Collector (WEC) service are free and already built-in tools since 2003. While these are absolutely great one should know their limitations:
- The first and most important limitation of the approach described in this post is that it is not a click-and-ready-to-use SIEM solution. You have to setup your environment, configure and (most importantly) develop and improve your analysis (important events, malicious behavior, etc.). It's not like Microsoft has their powerful threat intelligence knowledge baked into the WEC service which points out all the important things to you.
- If you read the What about the Cloud? section you might reckon that Microsoft's interest are (currently) cloud-centric. With that being said, one should not expect a flawless and click-and-enroll experience. You will experience errors, hiccups and debug problems when enrolling this event collecting mechanism in your environment. However, if you do have administrators or a security-team that knows how to deal with Windows environments you can work through the hiccups, gain visibility and security controls while building the skills and knowledge of how to operate and improve your new tools.
I'm uncertain with the caveats and the cloud, what would you recommend doing with this then? The steps described above are just one part/one path in a bigger picture that is labeled with the question "Is there any solution in place that allows you to detect an attack?" I've embedded the option to use/try Windows Event Forwarding (WEF) and the Windows Event collector service (WEC) in the below decision tree:

Based on the graph above and to re-iterate my key message from the beginning, my recommendation on what to do with this is:
Any company that operates on Windows devices and/or servers can utilize Windows Event Forwarding and the Windows Event Collector service to build or develop detection and visibility capabilities. When it comes to a Make-or-Buy decision for building those capabilities, WEF & WEC are a great toolset to start a 'make-process'.
If you'd like to chat about this topic more in-depth or discuss options to build detection systems, challenge your existing detection capabilities by running a simulated attack, feel free to reach out to us at https://www.securesystems.de/offensive-security-services/#contact.
